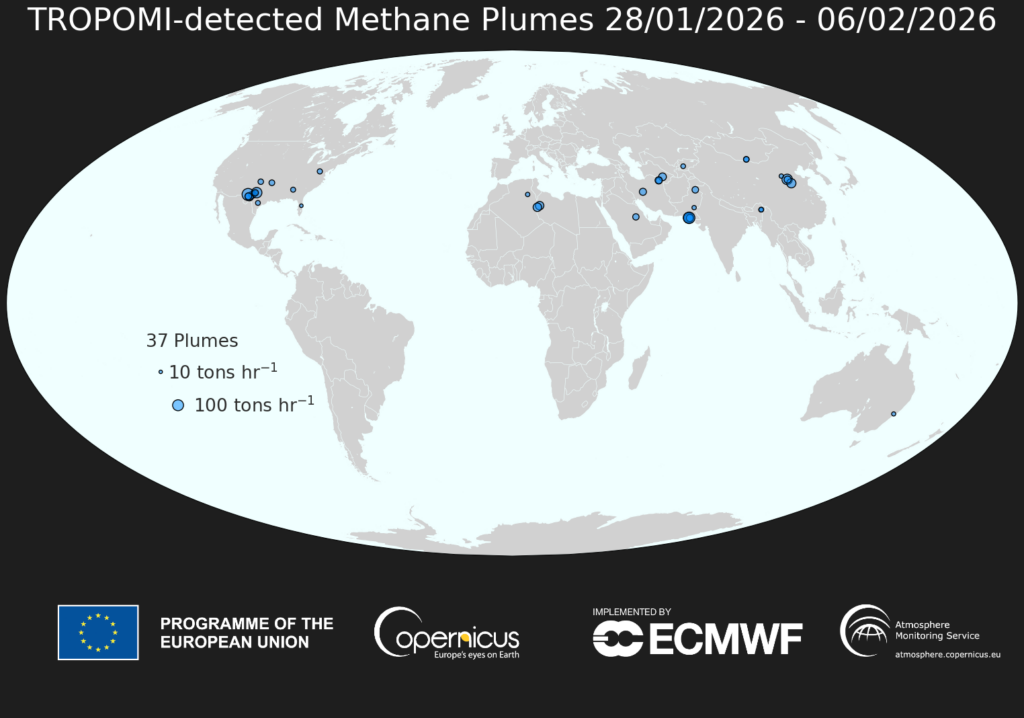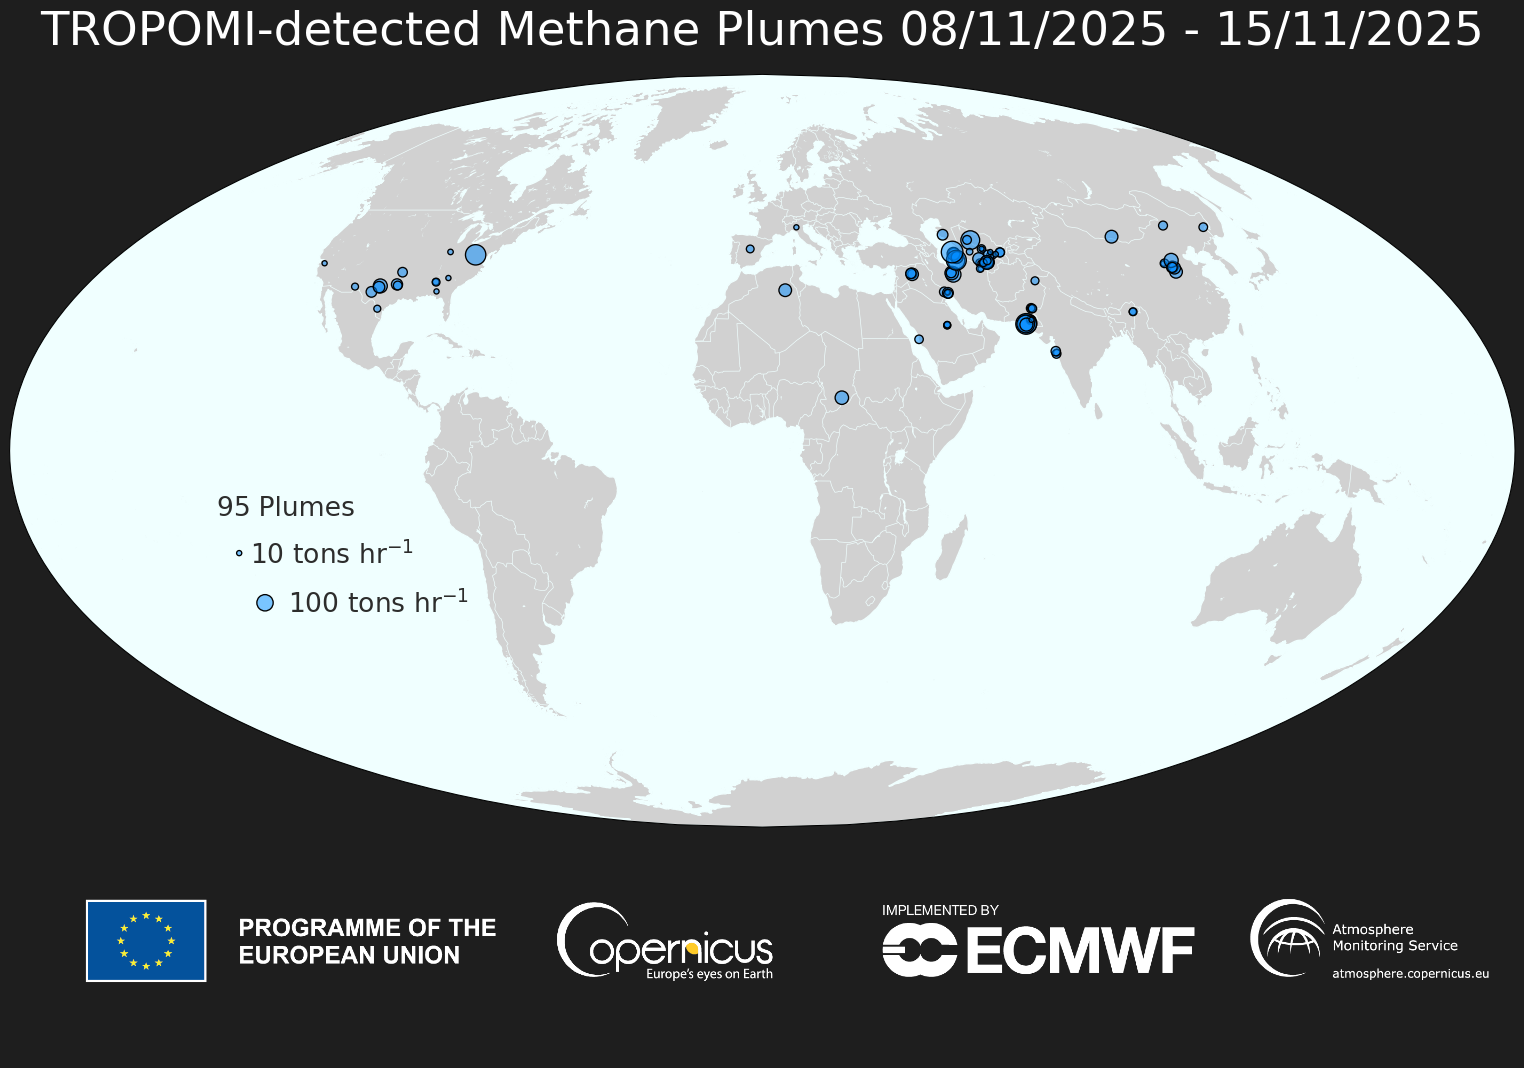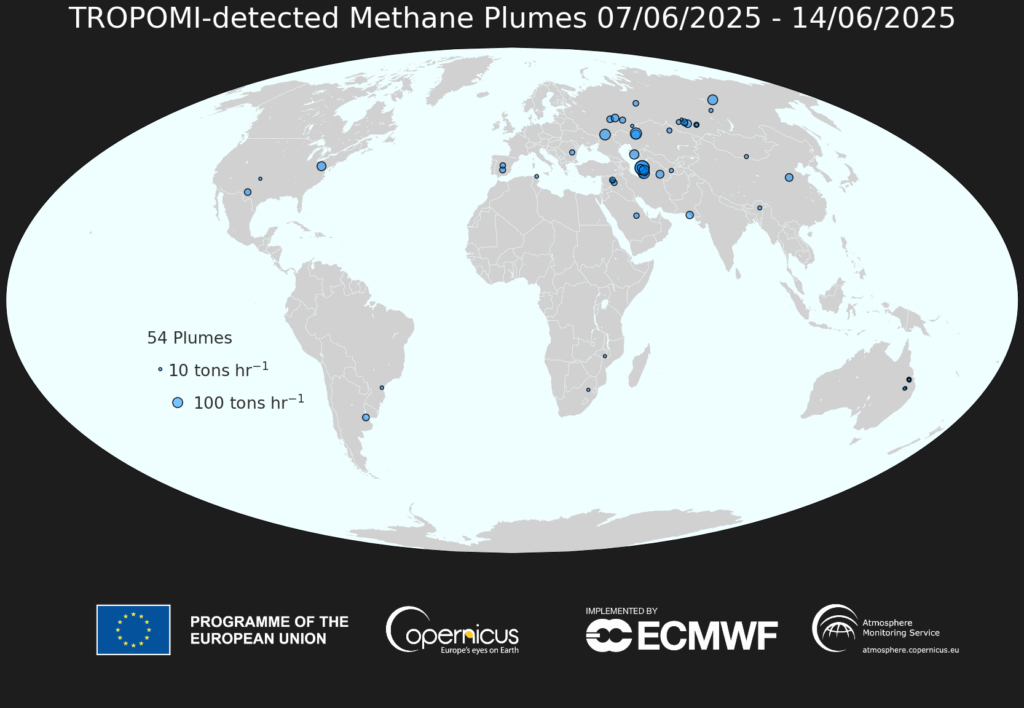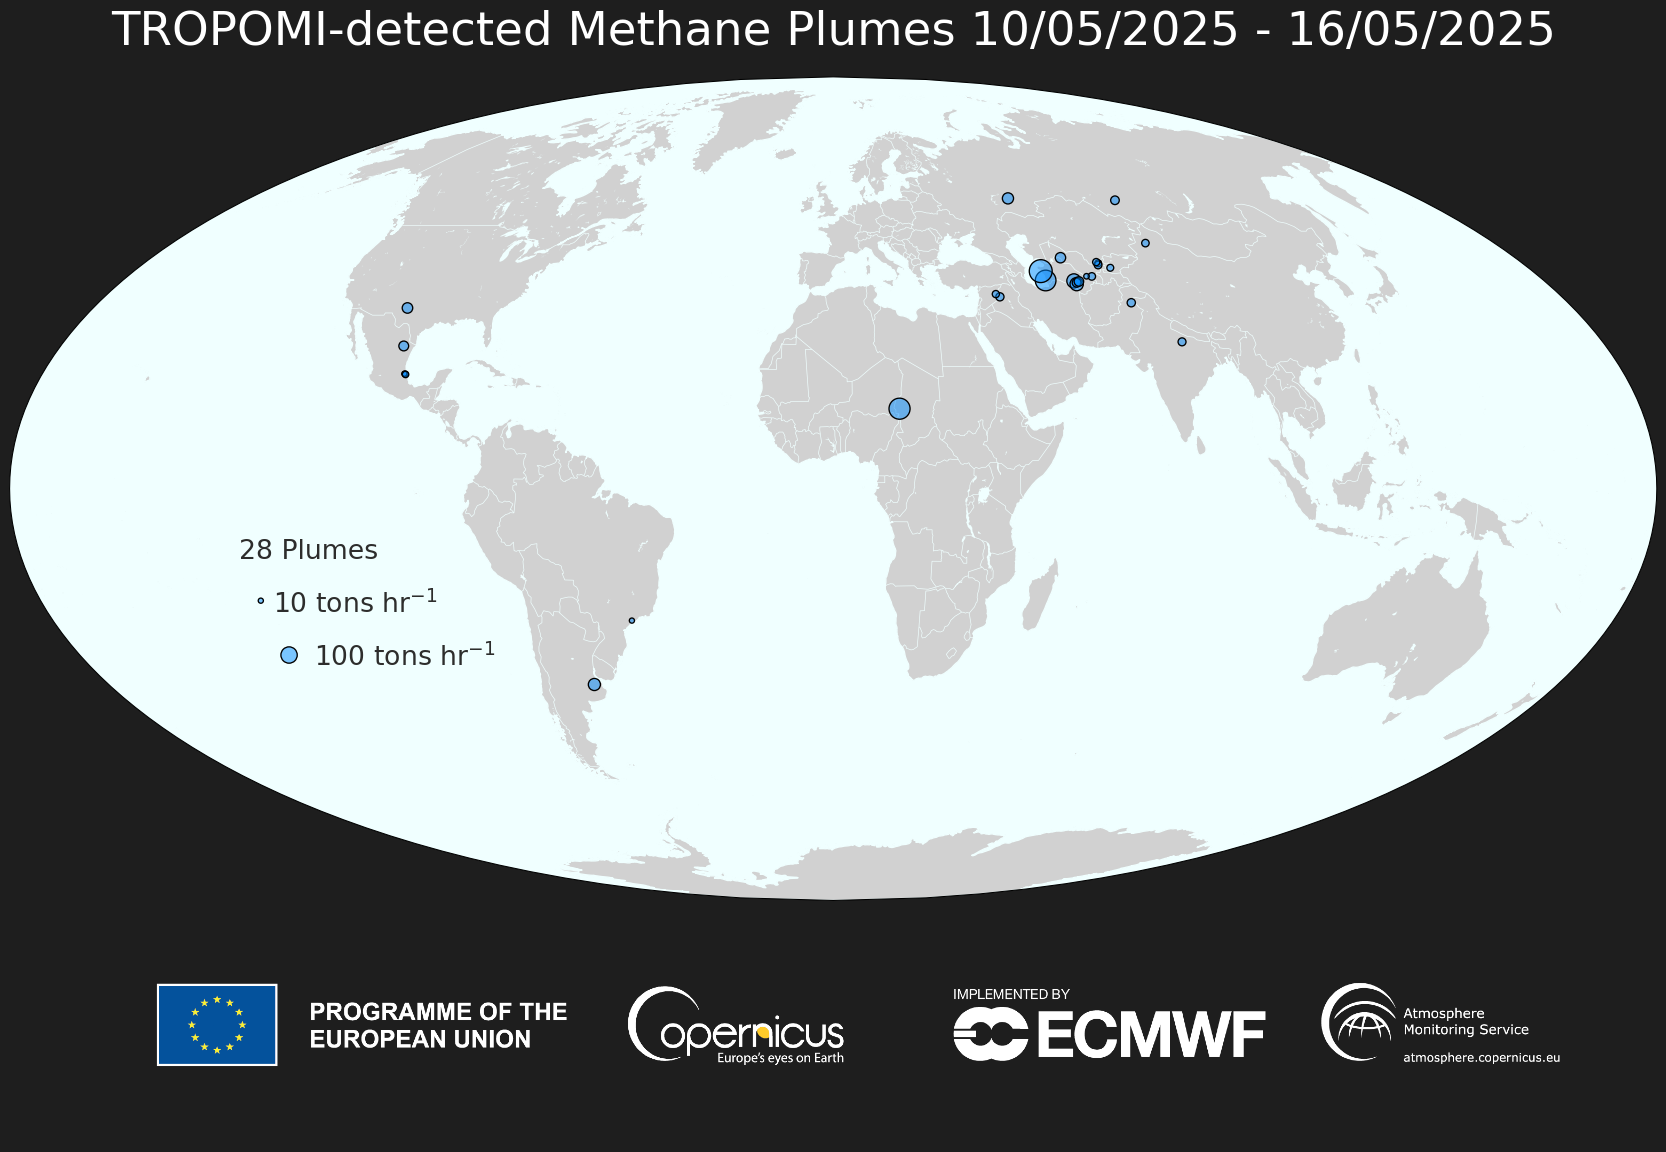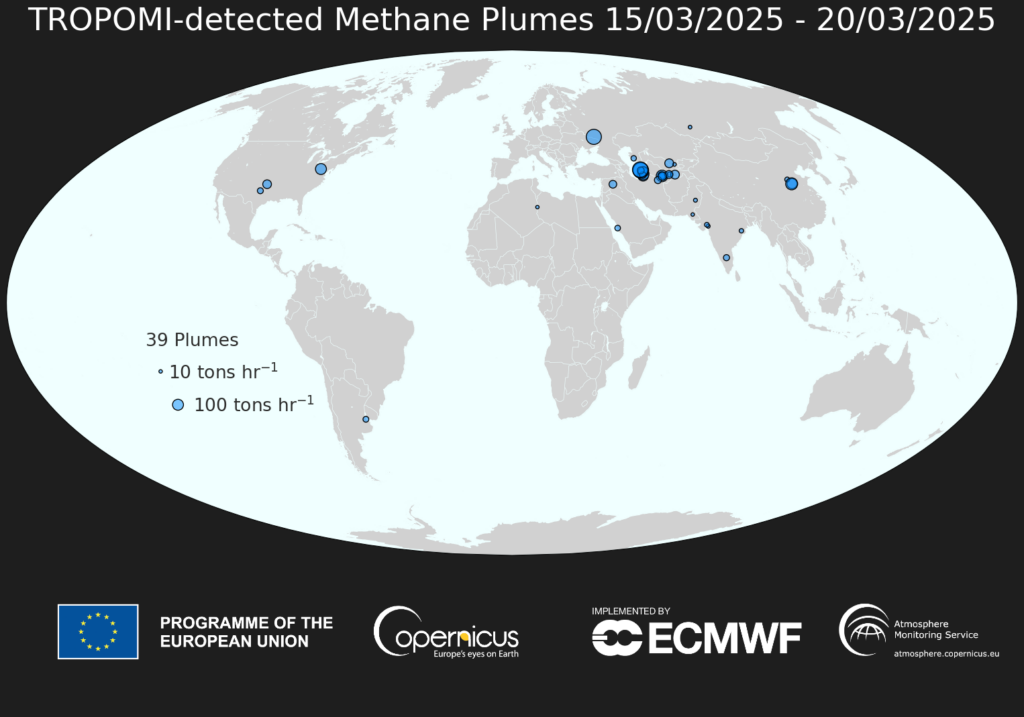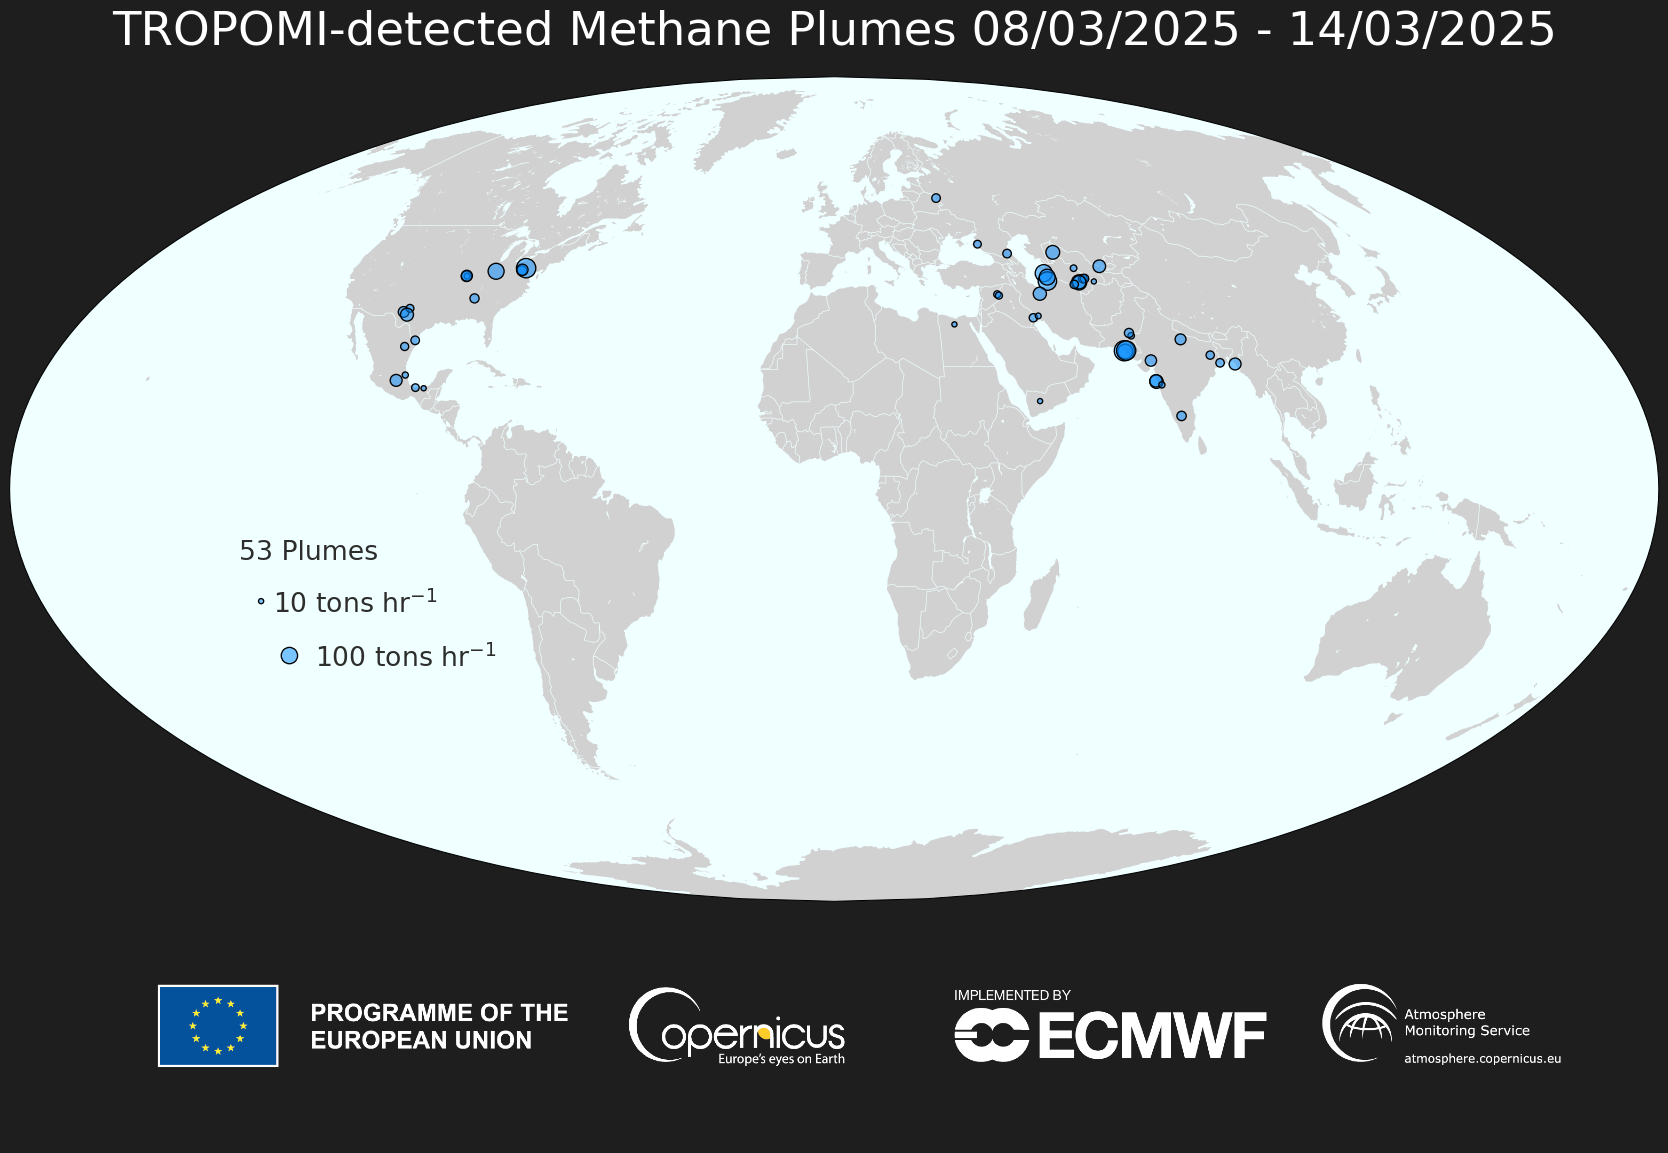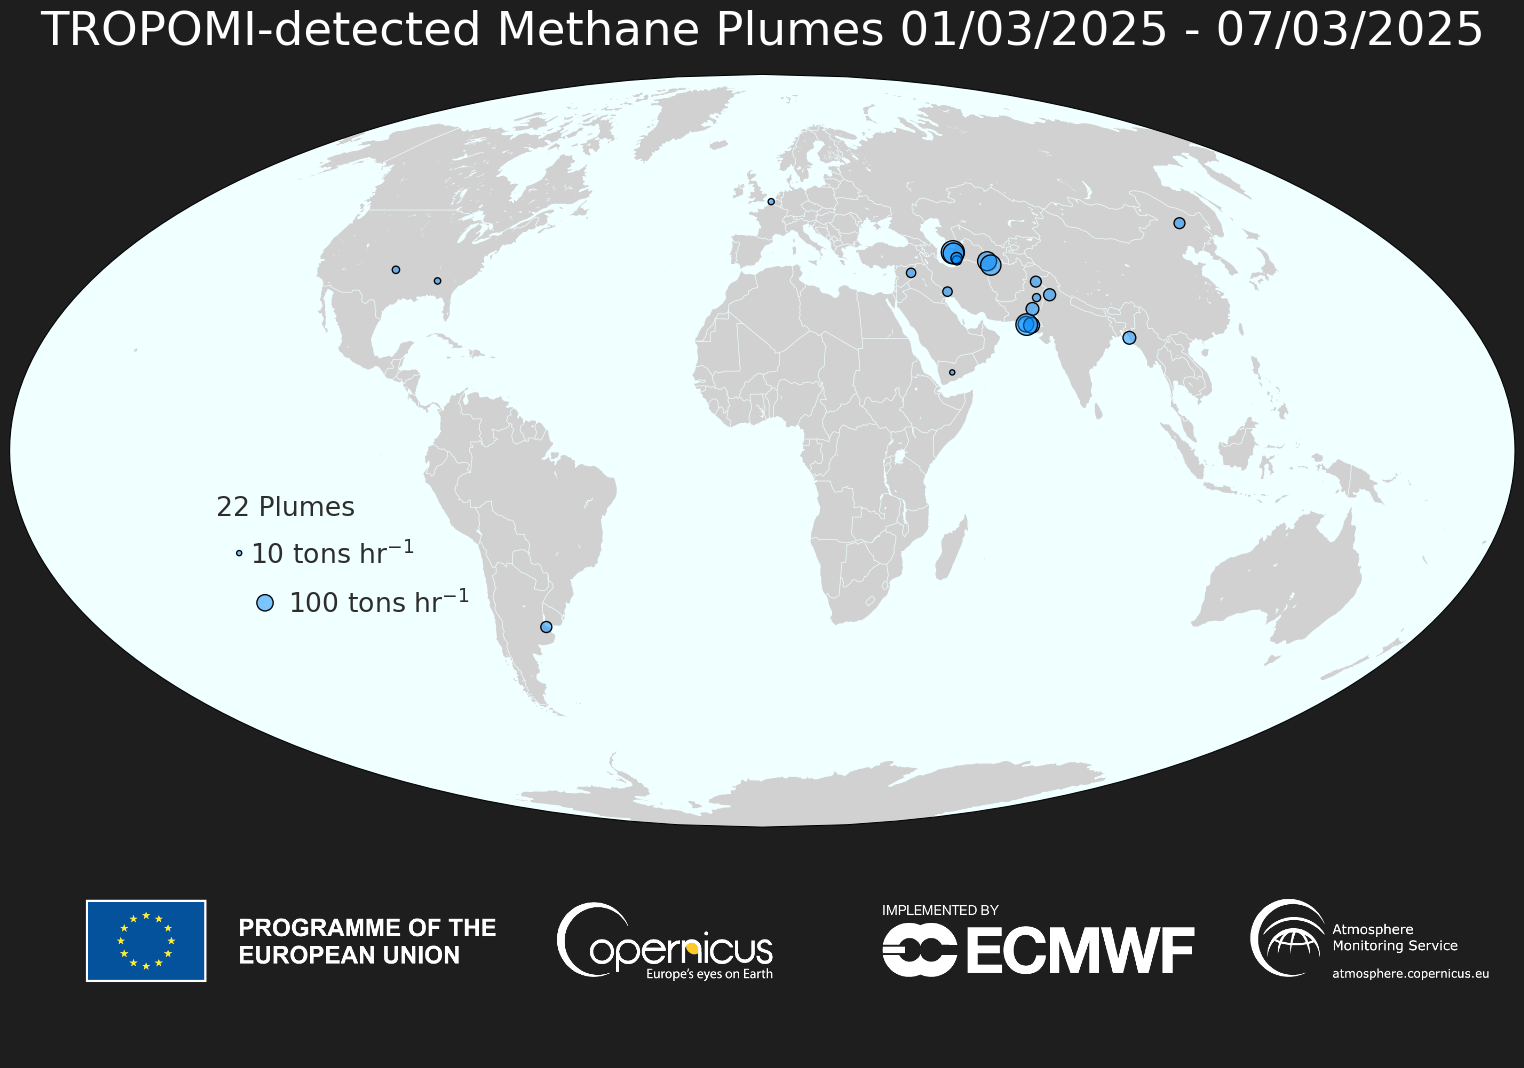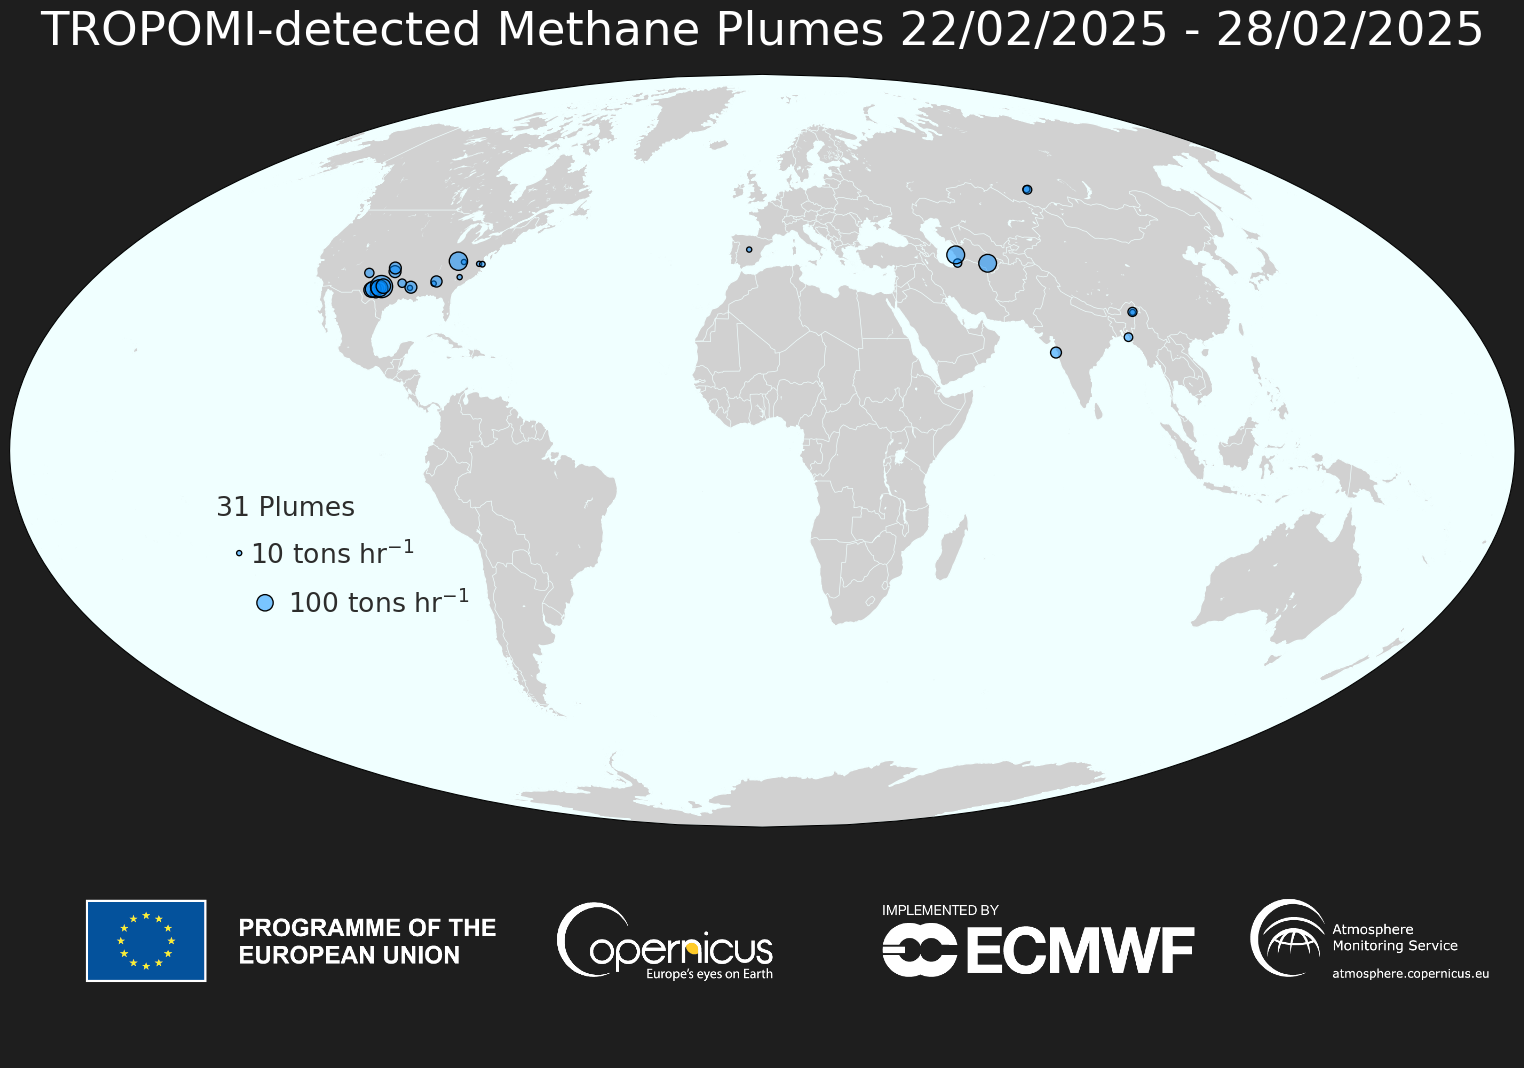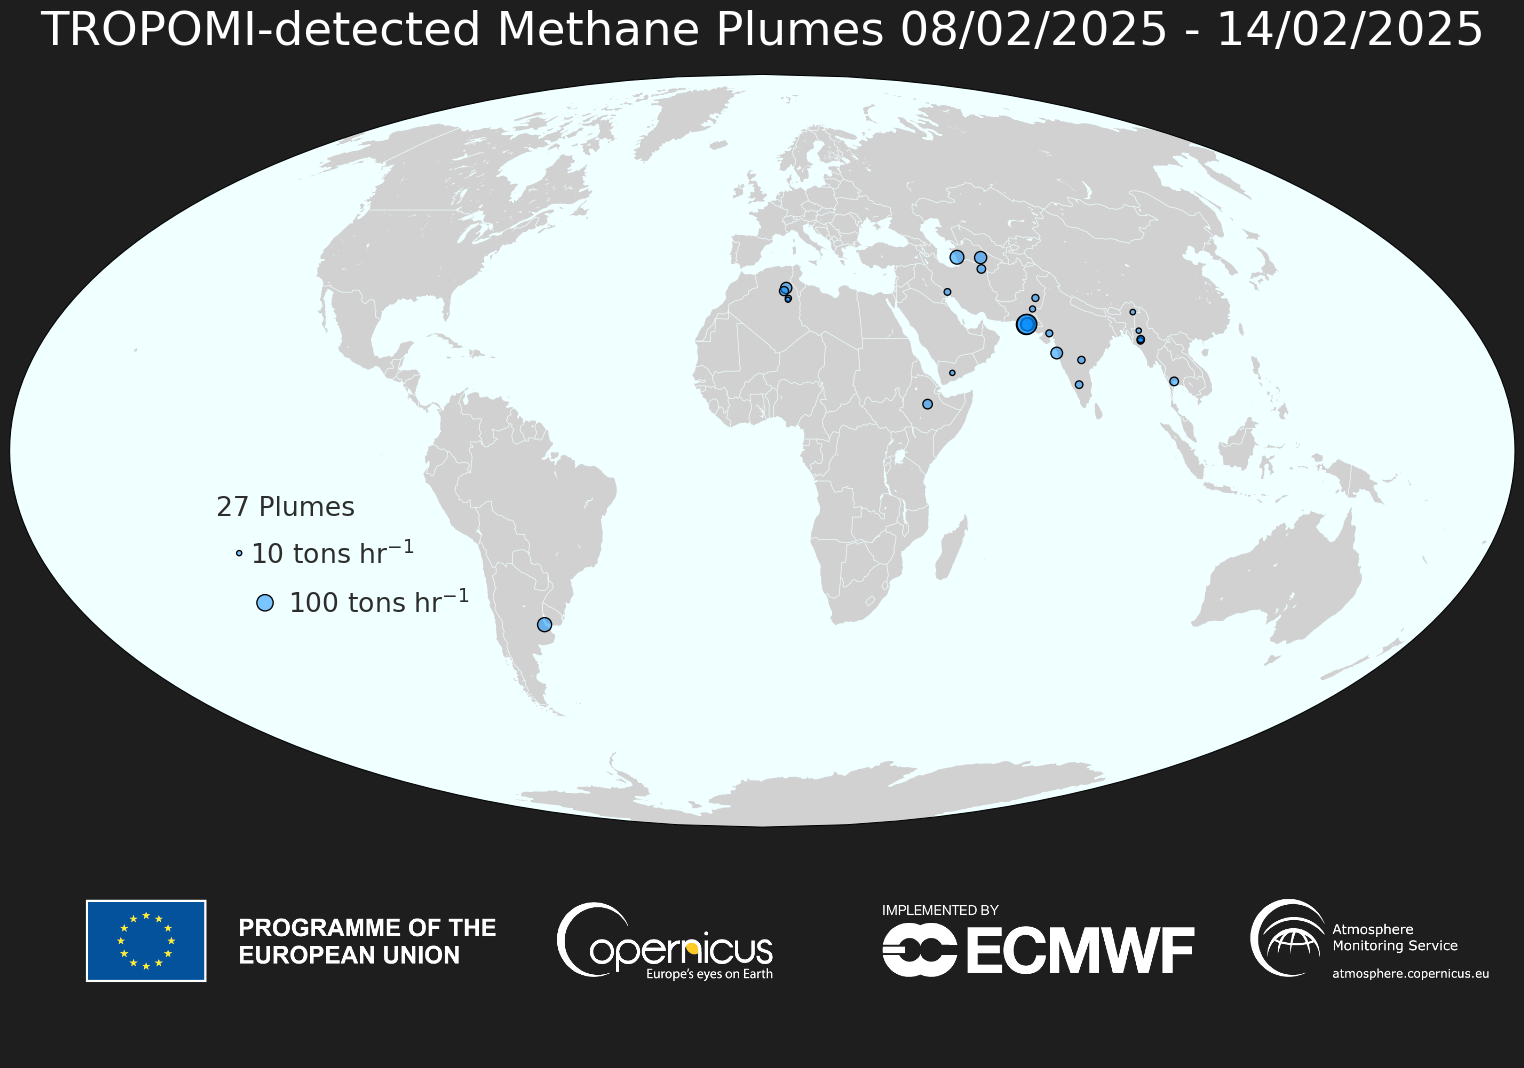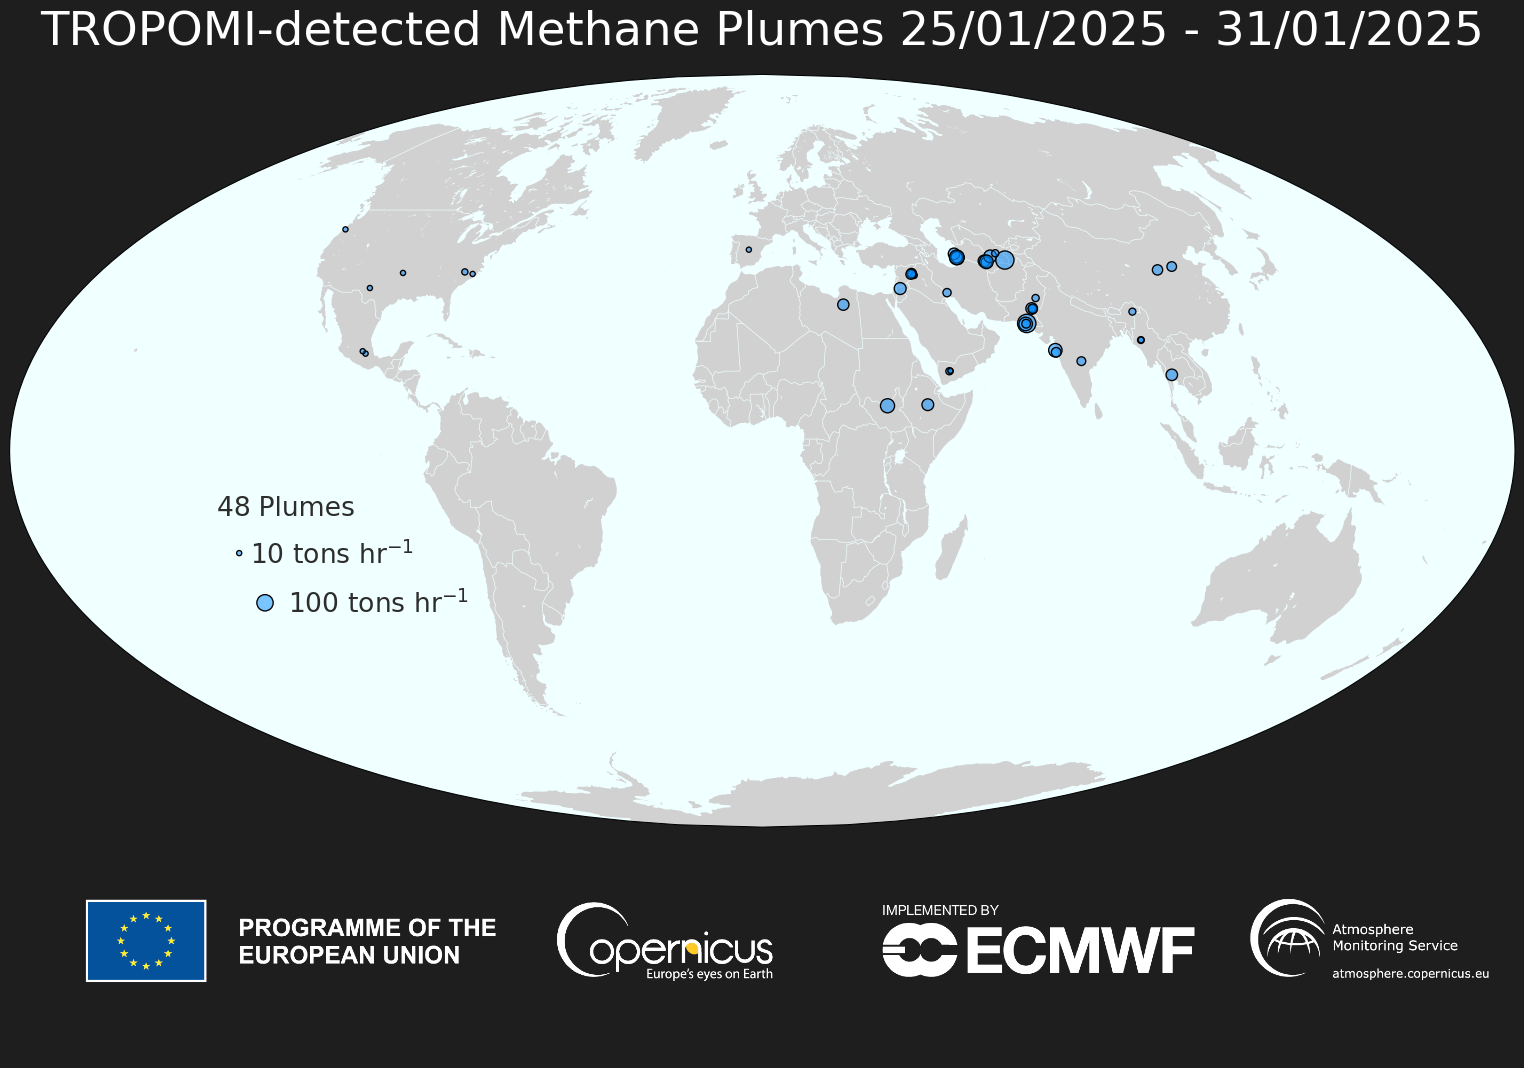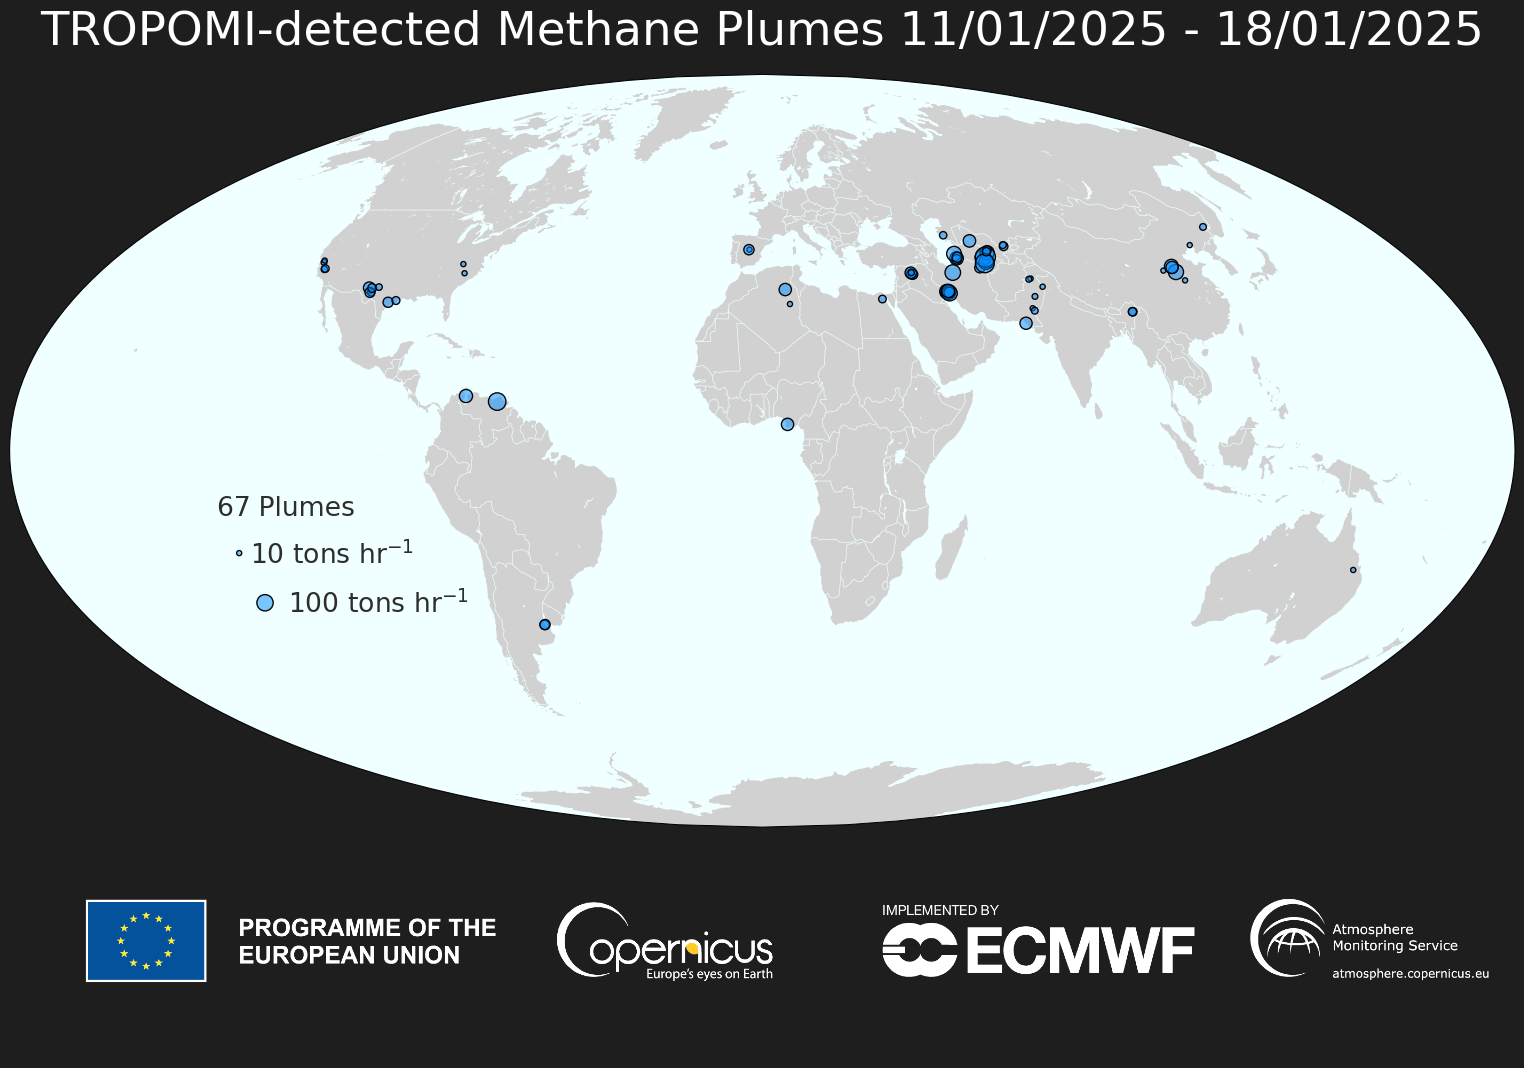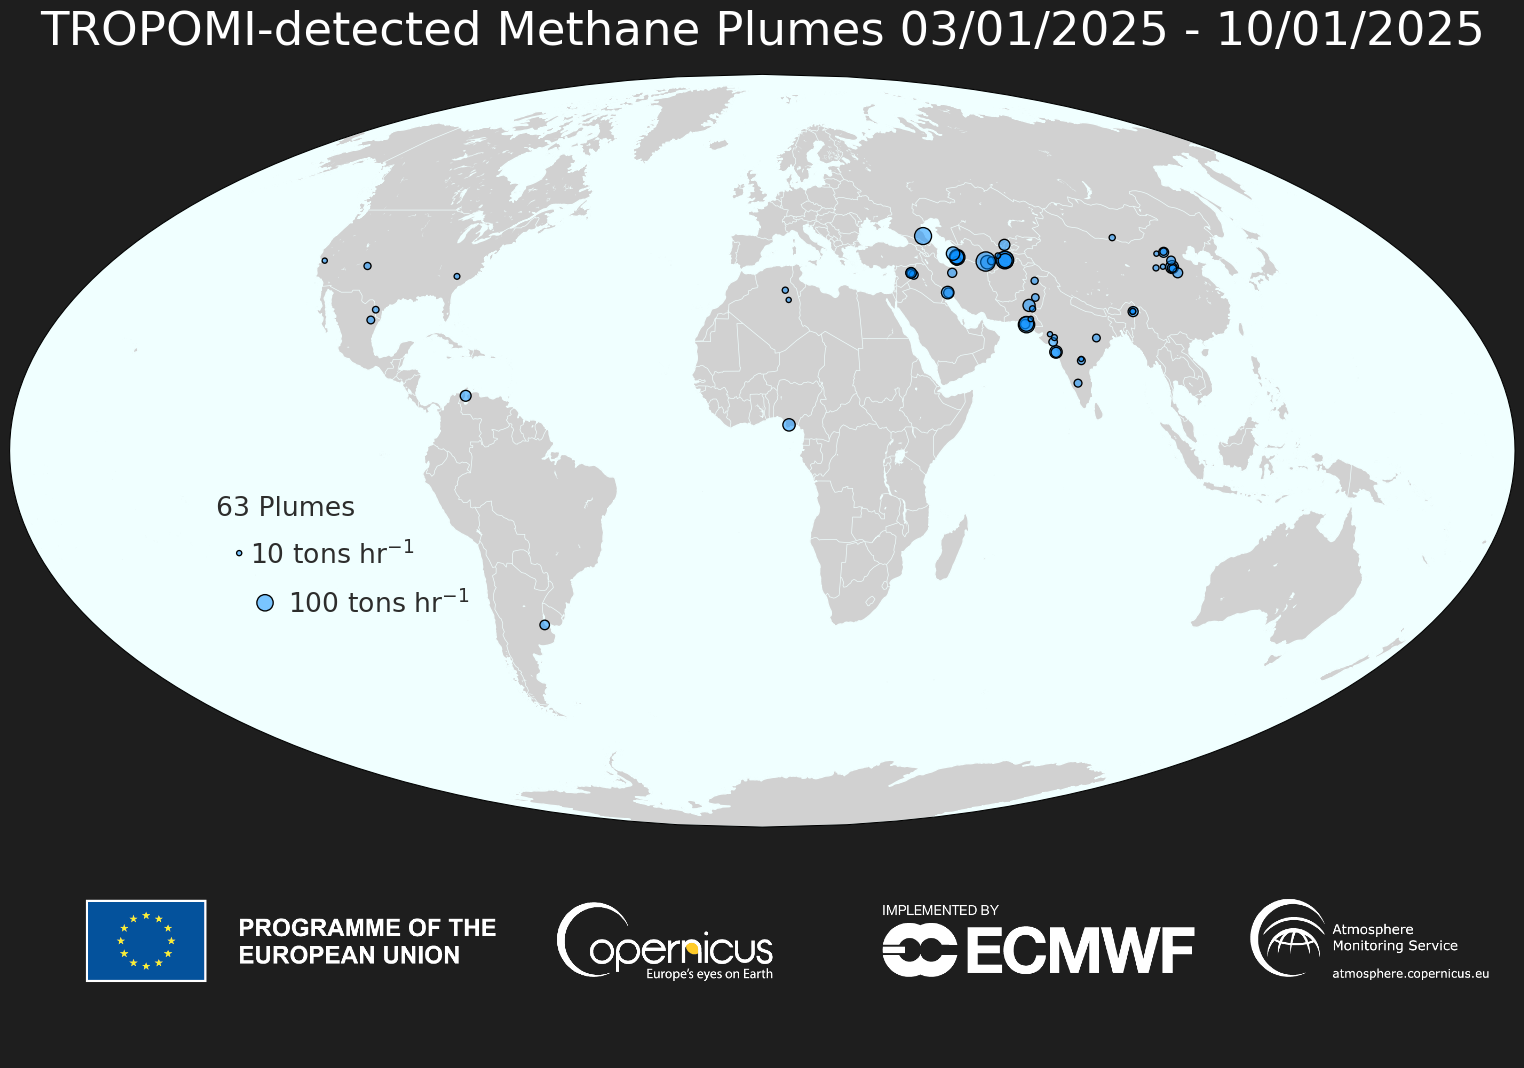


About the maps
We use the Dutch space instrument TROPOMI onboard Sentinel-5P to automatically detect large methane emission plumes across the globe. The machine-learning technology for this is described in Schuit et al. (2023). The world maps show approximate source locations based on single TROPOMI plumes and initial source rate estimates calculated using an automated mass balance method. The number of detections fluctuates from week to week because of varying emissions, cloud cover, and viewing geometry. Plumes have only been subject to initial verification. Precise quantification and final interpretation require more extensive evaluation. The detections exclude larger-scale enhancements such as seen over the Permian Basin or over wetland areas. We only show the clearest and most confident plumes here. At the end of the year, we will publish a more complete/thorough analysis of all detected plumes.
The weekly data can also be found on our FTP server. These methane plume detections are also available on the CAMS Methane Hotspot Explorer.
Generated using Copernicus Atmosphere Monitoring Service information [2024]. If you use these detections for your research or other purposes, please let us know. We are happy to collaborate with anybody interested in these detections. This work is licensed under a Creative Commons Attribution 4.0 International License. When referencing the data, please credit the product generation to the SRON team (earth.sron.nl/methane-emissions/) and cite the Schuit et al. (2023) publication;Copernicus (modified) Sentinel-5p data have been used.