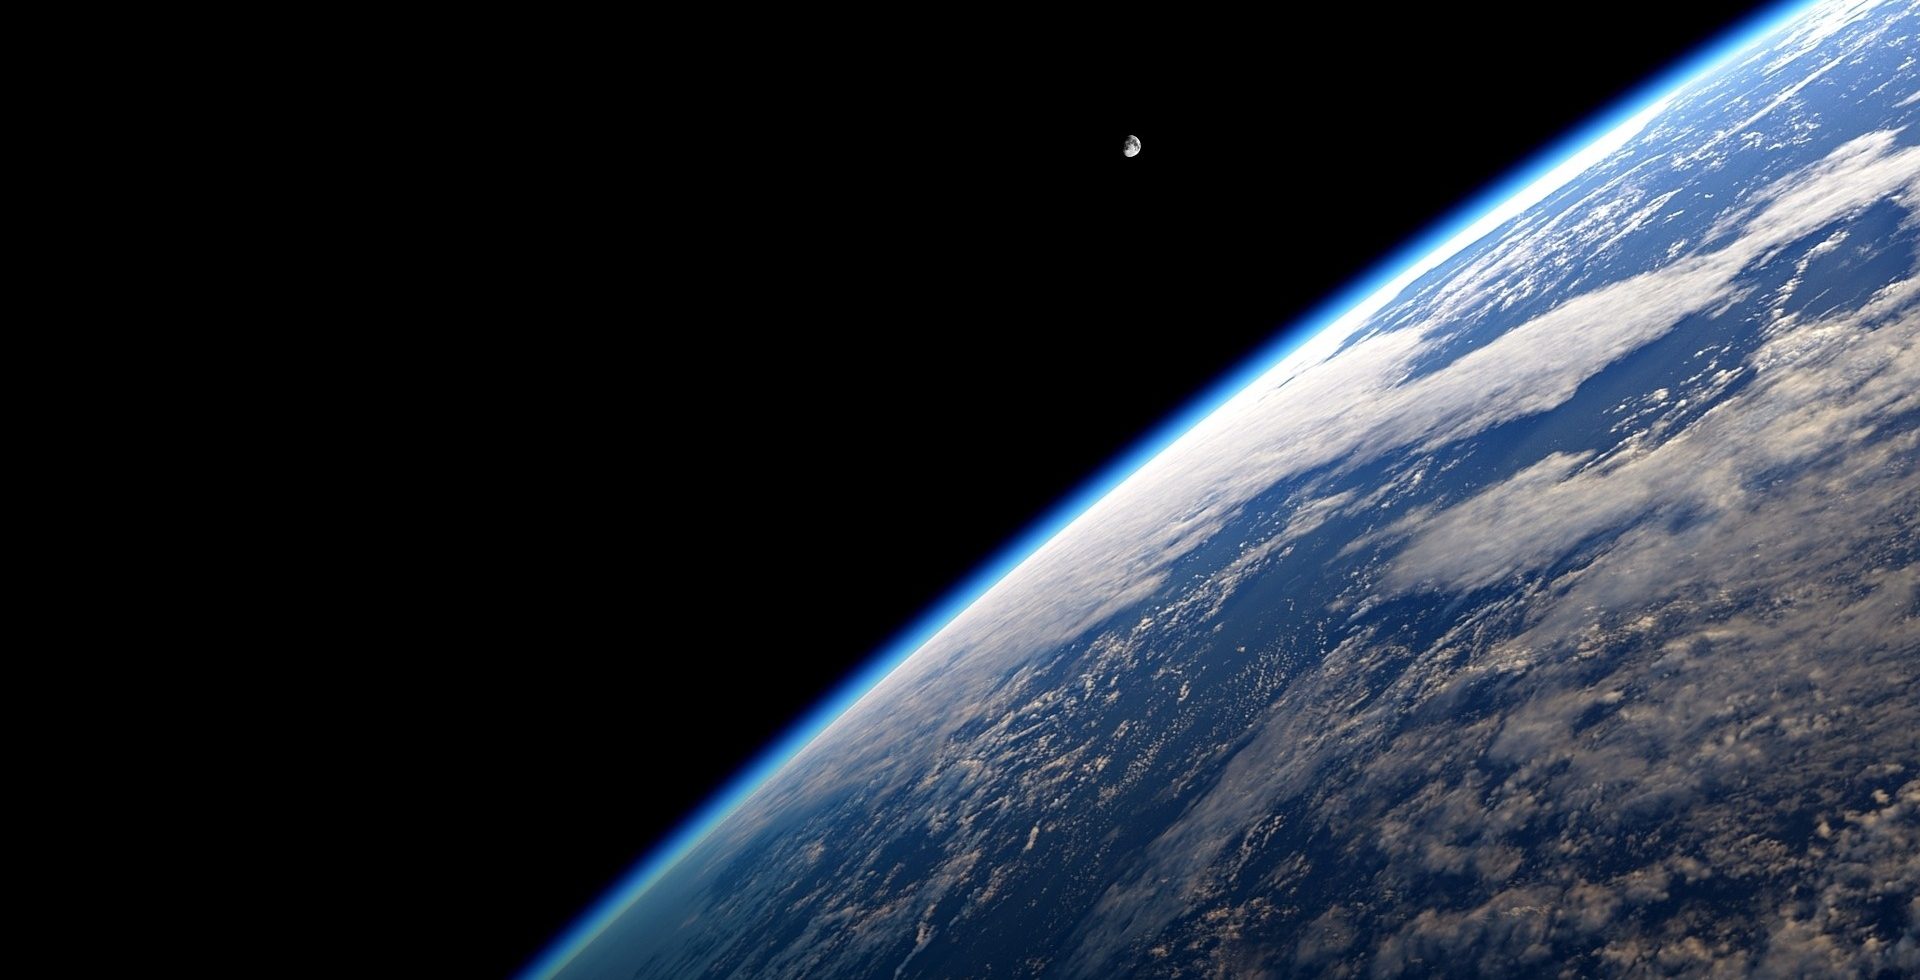
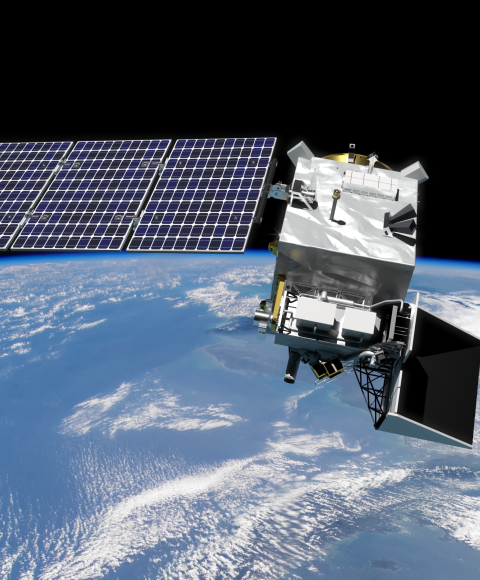
Watchful eyes over our planet
We conduct urgent research into climate, air quality and ecosystem impact. Earth’s climate is changing because of manmade greenhouse gas emissions. Carbon dioxide and methane are the two main contributors to the enhanced greenhouse effect. Aerosols cool the Earth by scattering and through cloud formation, but it is uncertain by how much. Global warming can trigger tipping points in the Earth’s ecosystem; we study for example permafrost thaw, wildfires and climate-cloud relations
Research Themes
-
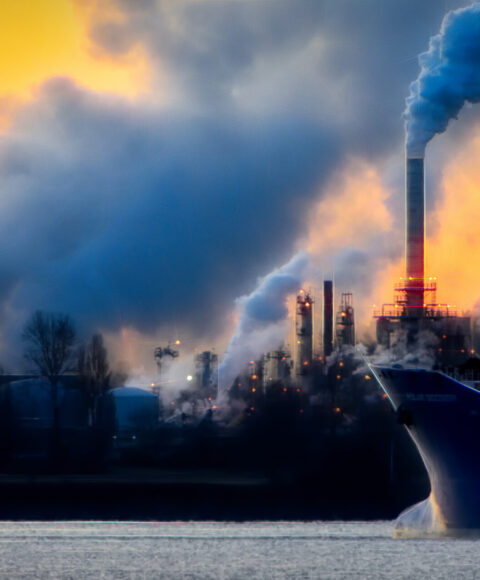
Methane
-
Responsible for ¼ of human-made greenhouse effect
-
About 30 times more powerful than CO₂ (GWP-100)
-
Large emissions from fossil fuel industry, landfills, livestock
-
-
Aerosols and Clouds
-
Small particles in the atmosphere
-
Largest unknown factor in climate change
-
Strong impact on air quality
-
-
Carbon Monoxide
-
Reactions with atmospheric gases contribute to global warming
-
Trace gas to calculate CO₂ emissions from forest fires
- One of the most important air pollutants
-
-
CO₂
-
Most important human-made greenhouse gas
-
Hard to monitor emissions because of long lifetime
-
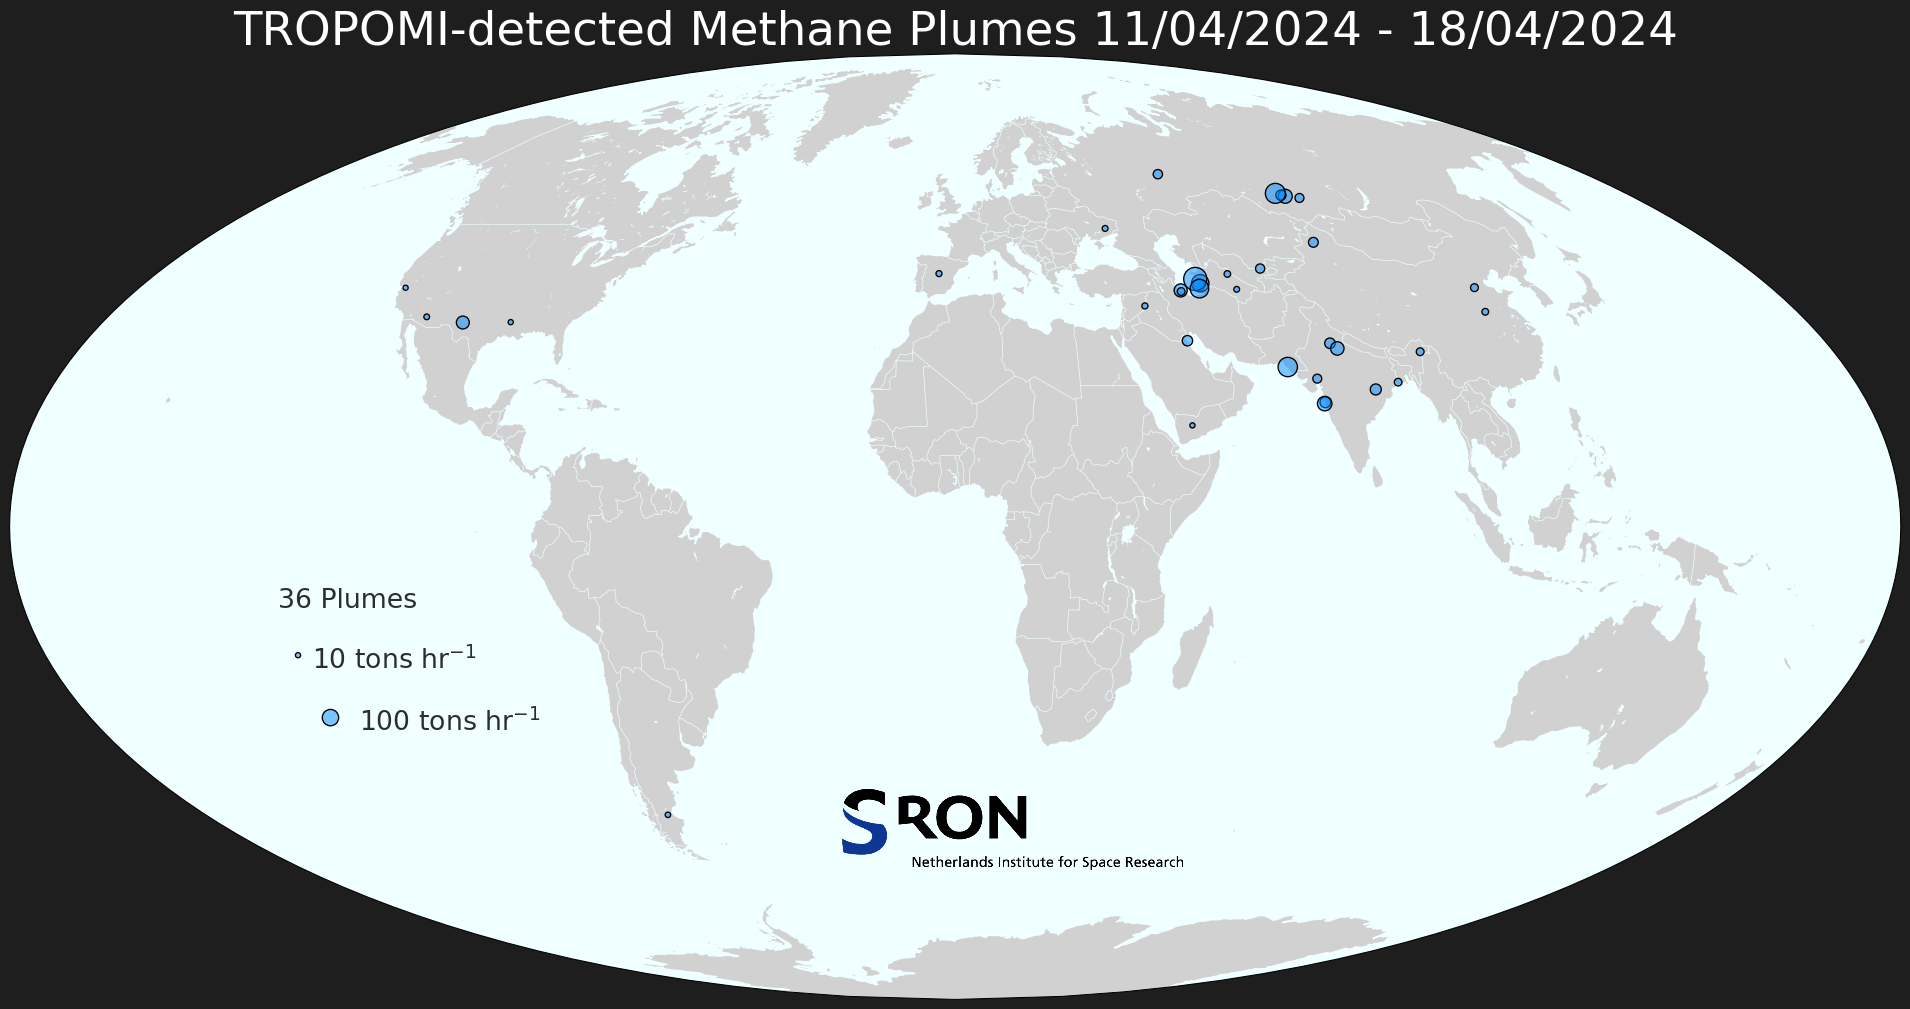
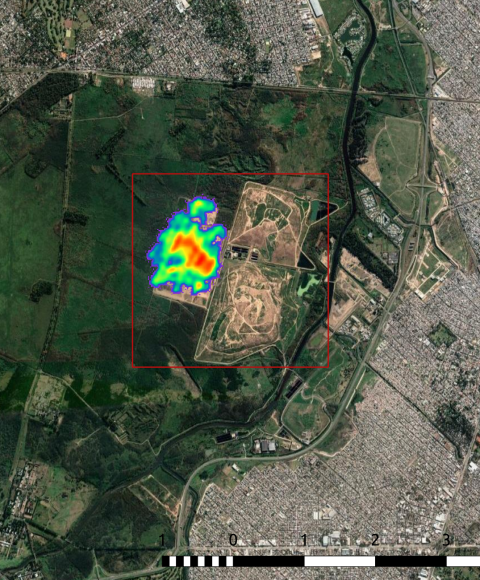
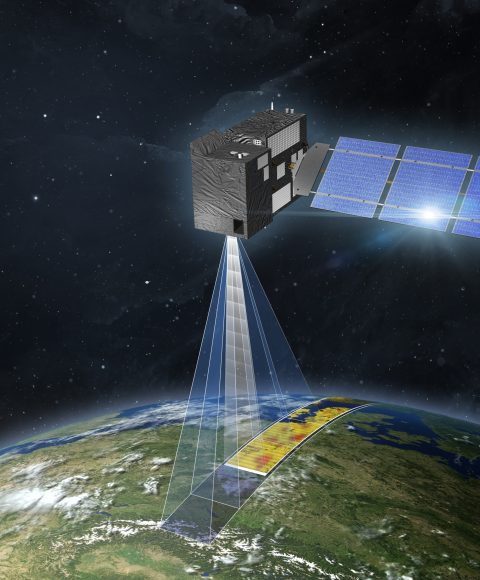
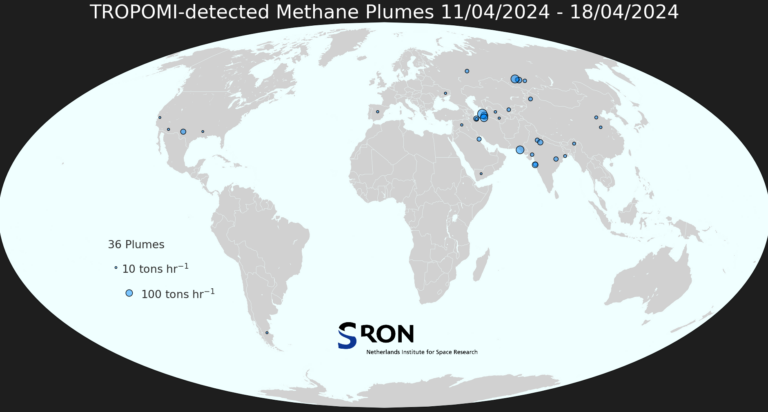
Methane Plume Maps
TropomiTROPOMI aboard Sentinel-5p can be used to detect large methane emission plumes everywhere around the world. These plumes are automatically detected using the machine-learning setup described in Schuit et al. (2023, ACP). The weekly world maps show approximate source locations based on single TROPOMI plumes as well as initial source rate estimates based on an automated mass balance method.
The Earth programme is headed by dr. Aaldert van Amerongen. It consists of the Earth Science Group attached to the program and instrument specialists assigned to the program.

Aaldert van Amerongen
Head of the SRON Earth Observation Program